Blank BBT Chart & Instructions to Detect Ovulation


Learn how your temperature changes during your cycle and how you can use this information to detect ovulation.
Your basal body temperature is the lowest body temperature attained during rest, usually after sleep. Approximately one to two days after ovulation, a woman's BBT will rise slightly and stay higher for at least 10 days. You can record your BBT to accurately detect if you ovulated and you can use this information to help predict future ovulations and I'll be explaining exactly how you can do this.
First, let us understand why there is a change in BBT during the cycle
The same hormones that control the phases of the menstrual cycle are responsible for raising BBT. Prior to ovulation during the follicular phase, higher levels or estrogen lowers BBT, then after ovulation during the luteal phase, higher levels of progesterone raise BBT.
So, how do we accurately detect ovulation by our BBT?
Get yourself an accurate digital thermometer, one that can measure to the tenth of a degree. For example, it can measure to 98.4F instead of just 98F. There are different types of thermometers available, some may have a memory recall feature, or beep to indicate that the the reading is finished, but the most important thing to check is "can it measure to one tenth of a degree"?
You are going to be taking you temperature everyday, so please ensure you know how to use your thermometer to get an accurate reading. Read the directions carefully. For example learn what the beeps mean or how long to leave it in if it does not beep.
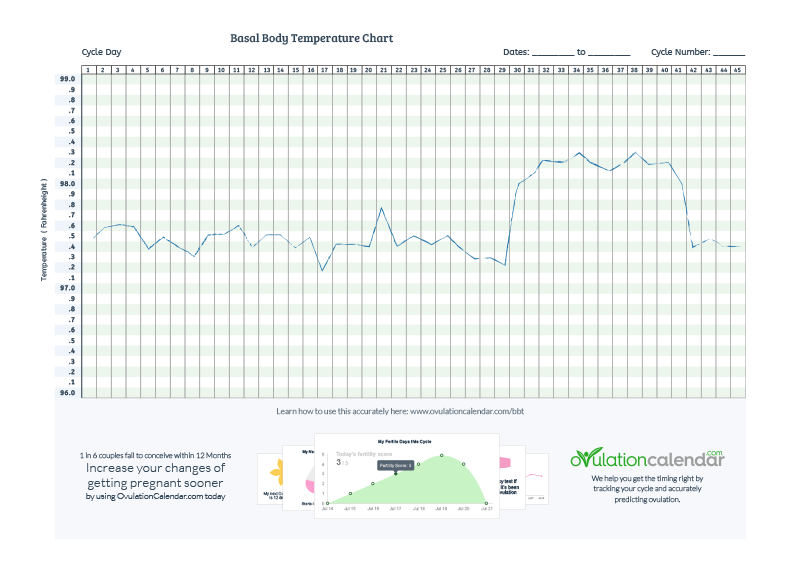
Download Blank BBT Charts
Before we begin the steps, decide if you are going to log your temperatures into Ovulation Calculator online via your phone or use one of our blank BBT charts below, click Celsius or Fahrenheit below to download.
Steps to measure your BBT accurately
- Leave your thermometer, pen, chart or phone on your bedside table.
- Take your temperature everyday at the same time, immediately after waking, before any activity, including even sitting up. You can set an alarm to make sure it's the same time each day.
- Take your temperature in your mouth. Insert the tip of the thermometer under your tongue and push it toward the back where the tongue meets the bottom of the mouth. Leave it there long enough to get an accurate reading.
- Log your temperature into your chart by marking a cross (x) in the box that corresponds with both the temperature and the cycle day; or
- Log the temperature into Ovulation Calculator via your phone if you are using our website to predict when you're fertile.
- Repeat every day.
- Make a note of any disturbances such as fever, stress, alcohol the night before, so that you can take this into account when analyzing your cycle (more on this below).
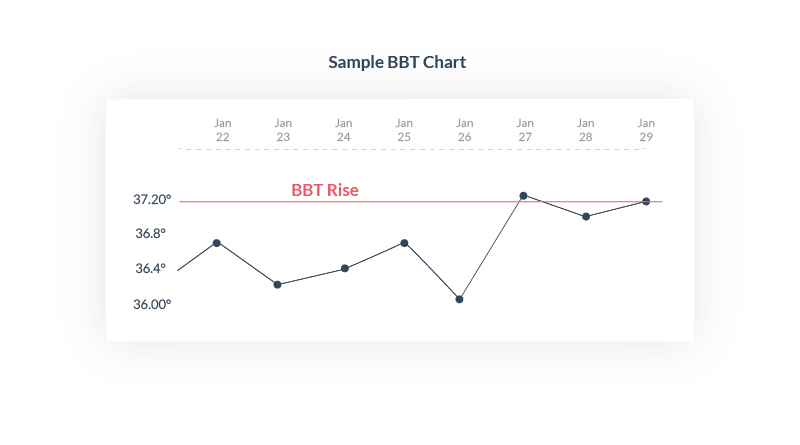
Here's a sample of a basal body temperature chart:
Using the results to detect when you ovulated
Your BBT will rise slightly after you ovulate (see above sample), only by about 0.5 to 1 degrees Fahrenheit (about 0.3 to 0.5 degrees Celsius). Look for the temperature rise on your BBT chart. Your fertility reaches it's peak two to three day BEFORE your temperature rise.
Predict future ovulations by using the following formula
- Count the number of days from the temperature rise to the day before your next period.
- Add two to this number (we add two because the rise is approximately two days AFTER ovulation).
- Deduct the number from your average cycle length.
For example, if your average cycle length is 30 days and the number of days between your BBT rise and day before your next period was 11, you would add 2 to 11, to give you 13 (estimated ovulation day was 13 days before your next period). Then you would deduct 13 from 30 (your cycle length) which would give you 17. Your estimated day of ovulation is cycle day 17.
Ensuring you get accurate BBT readings
When you first start out monitoring your BBT it can be a little confusing. However, do not be concerned as it is typical for it to take a little while to get the hang of it never mind actually understanding what your temperature is telling you.
Despite your best intentions there are a number of factors that can affect your BBT and give you either a higher or lower than normal reading. These include:
- A late night
- Broken sleep
- Oversleeping
- Alcohol the night before
- Some pain relief medications
- Illness or fever
- Stress
- Drugs
- Travel
- Time zones
- Shift work
- Change of room temperature
- Breastfeeding
Following our advice on how to get an accurate reading will really help you to understand your cycle and identify when you are most fertile. Inevitably, normal life will sometimes get in the way and it is very difficult to prevent factors like stress or illness for example, from interfering with your recordings. So, in addition to the steps above, see the following to improve the accuracy of your readings:
- Check your thermometer regularly for any breakages and do not forget to replace the batteries regularly. If you do need to buy another thermometer, start using this at the beginning of a new cycle. If you need to use it sooner, make a note of when you did this incase the baseline reading changes.
- Try and keep your room at a constant temperature at night to avoid fluctuations in temperature due to your environment.
- Try to get at least three hours of uninterrupted sleep before taking your temperature at the normal time.
- When taking your temperature make sure you leave the thermometer in place for the required time.
- Try not to skip taking any readings, as this will not give you an accurate picture of your fertility for that cycle.
- Use a thermometer with a memory facility if you do not want to record your reading straight away. You can then fall back to sleep and record the reading when you get up to start your day.
Taking your BBT is easy and gives you helpful information about your cycle and your fertility.
Watch the video
Dr. Tash, leading fertility expert explains how to accurately chart your basal body temperature (BBT) to identify ovulation to learn when you are fertile.